
Key takeaways
- A 60 µm scan of a polymer battery electrode spans about six decades of current — pA in the binder, µA in the active particles.
- Standard conductive AFM saturates at its amplifier limit (typically 10 nA), adds capacitive interference and charges the surface; ResiScope™ III measures the full range in one pass without these artefacts.
- Soft ResiScope™ and HD-KFM™ III on the same area reveal particles that are both electronically disconnected and electrochemically inactive — the dead material behind capacity loss.
- The Nano-Observer II battery configuration adds glove-box operation, an electrochemical cell and a temperature stage.
Animated story
Battery electrodes: ResiScope™ vs C-AFM
ResiScope maps clear conductivity from pA to µA; C-AFM saturates, adds capacitive effects and charges the surface.
01
The sample
A composite electrode layer on its current collector — pA binder, µA particles.
02
One scan, six decades of current
ResiScope follows the current across six decades.
03
A fixed range clips — and the surface charges
Saturation — every particle above 10 nA reads the same value.
04
The switch happens mid-scan
Soft Interaction Control: no shear, no scratching.
Battery Electrodes Span 10 Orders of Magnitude in Conductivity
A single 60–80 µm scan of a polymer battery electrode contains domains ranging from picoampere-level insulating binder phases to microampere-level conductive active material — a dynamic range that saturates standard C-AFM amplifiers and makes conventional conductive AFM fundamentally unreliable for this measurement.
Battery electrode performance is governed by local heterogeneity at the nanoscale. Active material connectivity, conductive additive distribution, and SEI layer uniformity all determine rate capability, capacity retention, and cycle life — yet they vary dramatically from grain to grain within a single electrode cross-section.
Bulk electrochemical measurements (EIS, dQ/dV, rate testing) yield area-averaged responses. They cannot identify whether capacity fade originates from particle isolation, binder cracking, SEI growth, or conductive network disruption. AFM-based electrical mapping provides the missing spatial resolution — but only if the technique can handle the full dynamic range of the material.
Surface Potential and Conductivity — Same Area, Same Sample
The most complete picture of electrode function comes from correlating surface potential (local work function, charge state) with resistance/current (electronic conductivity, contact resistance) on the same 50×50 µm area. The Nano-Observer II enables both measurements sequentially without moving the sample.
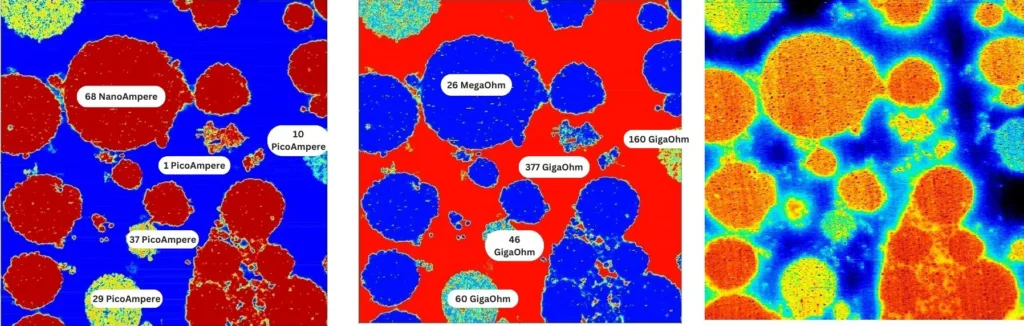
Figure 1. Soft ResiScope™ (left) and HD-KFM III surface potential (right) on the same 50×50 µm area of a polymer battery electrode. Resistance domains (Soft ResiScope) directly correlate with surface potential variations (HD-KFM III), linking electronic conductivity heterogeneity to local electrochemical potential differences across the electrode microstructure.
This correlated dataset reveals which domains are both electronically disconnected (high resistance in ResiScope) and electrochemically inactive (anomalous surface potential in HD-KFM) — the combination that identifies truly dead material contributing to irreversible capacity loss.
Mapping the Full Conductivity Landscape in One Pass
ResiScope™ imaging of polymer battery electrodes reveals a clear bimodal conductivity distribution: high-conductivity domains (active material particles, conductive carbon network) displaying current responses in the microampere (µA) range, coexisting with insulating or low-conductivity domains (binder, PVDF, inactive regions) showing currents of 1–70 pA.
In a 60×60 µm scan, this span of pA to µA represents 6 orders of magnitude — all measured within a single continuous scan pass using ResiScope’s real-time DSP-driven AutoGain. No manual gain switching. No saturation. No scan interruption.
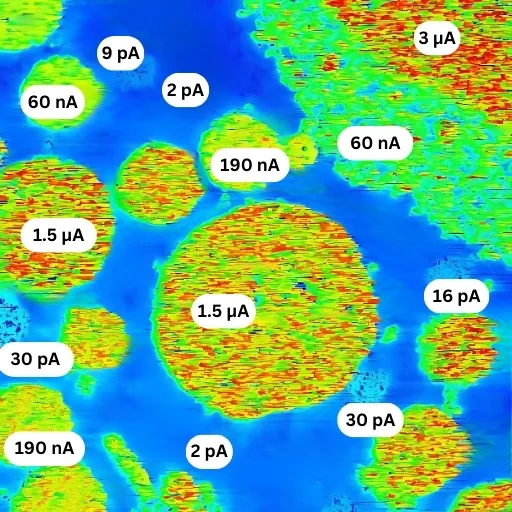
Figure 2. Polymer battery electrode — 60×60 µm ResiScope™ scan. High-conductivity domains (red/bright, µA range) correspond to active material particles with good conductive network contact. Low-conductivity domains (blue/dark, 1–70 pA) reveal insulating binder phases and isolated particles. Both regimes resolved simultaneously without saturation or manual adjustment.
Electrode Design Optimization
Identify isolated active material particles and poor conductive additive coverage — the root cause of localized capacity fade.
Conductive Additive Distribution
Map carbon black or CNT network connectivity across the electrode. Quantify percolation threshold and identify dead zones.
SEI Layer Characterization
Measure SEI resistance heterogeneity across grain boundaries and particle surfaces before and after cycling.
Degradation Analysis
Compare pristine vs cycled electrode resistance maps to localize degradation mechanisms — cracking, delamination, lithium plating.
Three Fundamental Artifacts of Standard Conductive AFM on Battery Materials
The same battery electrode imaged with standard C-AFM produces results that are quantitatively unreliable due to three systematic artifacts — none of which affect ResiScope measurements.
Current Saturation
Highly conductive domains saturate the C-AFM amplifier at its maximum (typically 10 nA), producing measured values ~100× lower than actual conductivity. Active material appears artificially similar to binder.
Capacitive Interference
Capacitive effects from highly conductive neighbors corrupt measurements of adjacent insulating domains. Small resistive regions cannot be accurately measured when surrounded by conductive particles.
Surface Charging
Without protective resistance options, C-AFM causes observable surface charging along the scan direction — appearing as a systematic baseline tilt in cross-sectional profiles and false conductivity gradients.
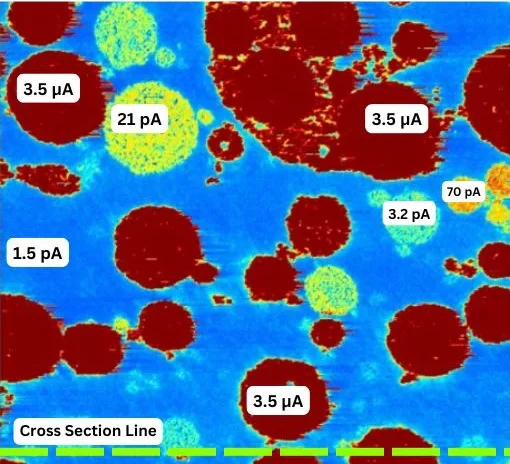
Figure 3a. ResiScope™ — Accurate
Full dynamic range resolved. Distinct µA conductive domains and pA insulating phases clearly separated. No saturation. No charging artifacts.

Figure 3b. C-AFM — Artifacts
Conductive domains saturated at 10 nA amplifier limit. Surface charging visible as directional gradient. Capacitive interference distorts insulating domain boundaries.
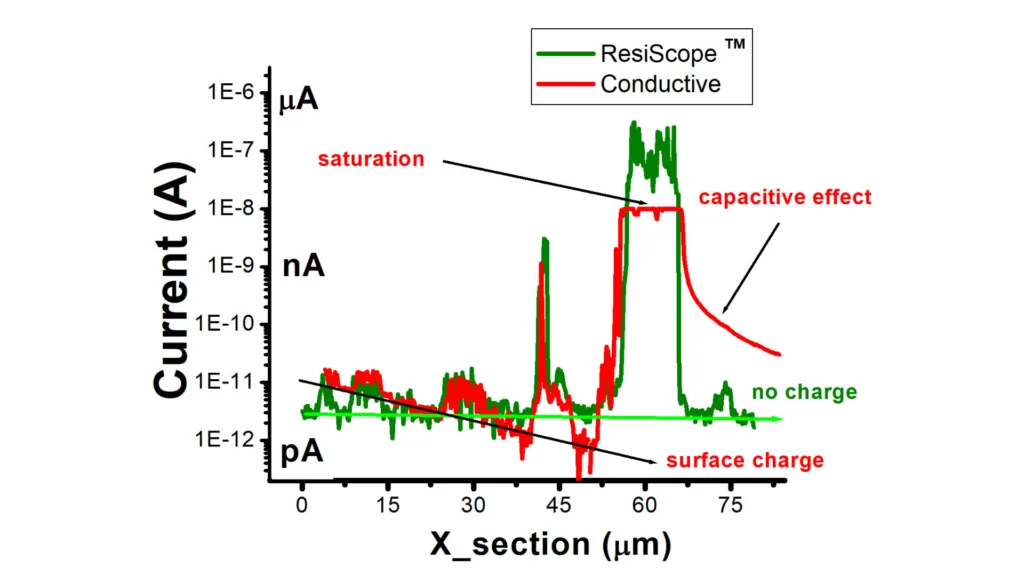
Figure 3c. Cross-section analysis along the same line. ResiScope profile (teal) faithfully captures the full current range from pA to µA. C-AFM profile (grey) shows hard saturation at the 10 nA amplifier ceiling on conductive domains, and a negative baseline tilt caused by surface charging — making quantitative comparison between domains impossible.
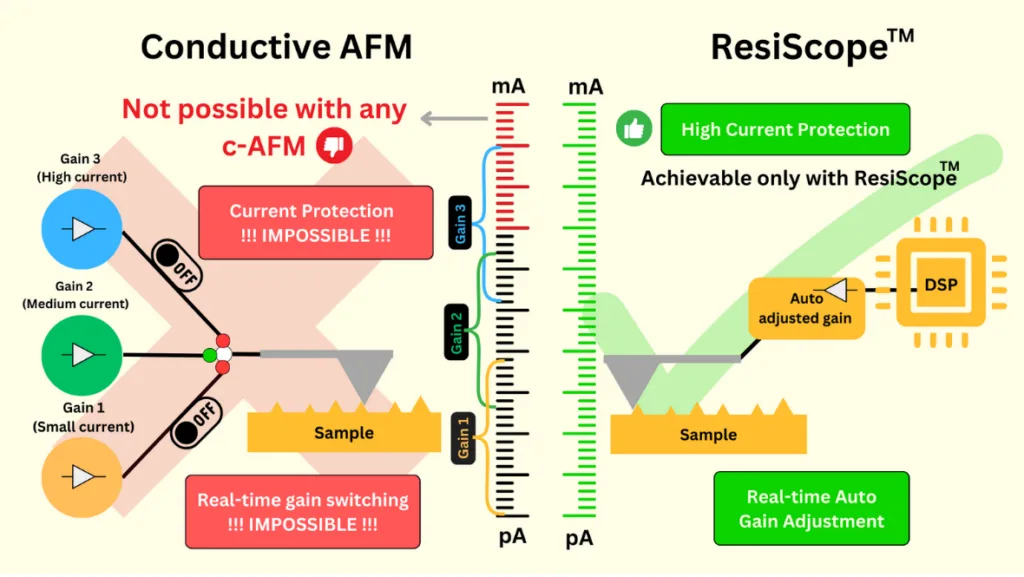
Figure 4. Schematic comparison of the two amplifier architectures. Conventional C-AFM relies on fixed gain stages that must be switched manually, making real-time gain adjustment and active current protection impossible during a scan. ResiScope™ uses a DSP-driven amplifier that adjusts its gain automatically in real time, covering the full current range in a single pass while actively protecting tip and sample.
ResiScope™ vs Standard C-AFM for Battery Applications
| Parameter | ResiScope™ III | Standard C-AFM |
|---|---|---|
| Current Range | fA to μA (10 decades) | ~1 pA – 10 nA (4 decades typical) |
| Resistance Range | 10² – 10¹² Ω in one pass | Limited; saturates on low-R domains |
| Gain Adjustment | Real-time AutoGain (DSP) | Manual; one fixed gain per scan |
| Saturation on Conductive Domains | None | Systematic — values ~100× underestimated |
| Surface Charging Artifacts | Absent (integrated protection) | Present — directional baseline tilt |
| Quantitative on Battery Materials | Yes — absolute R and I values | Unreliable in mixed-conductivity samples |
| Soft Sample Variant | Soft ResiScope™ (friction-free) | Contact mode only — damages polymer binders |
| Combined with KPFM | Yes — same scan area, Nano-Observer II | Not available in standard C-AFM systems |
Nano-Observer II — Battery Research Configuration
The Nano-Observer II integrates ResiScope III, Soft ResiScope, HD-KFM III, and PFM in a single platform with electrochemical cell and glove-box compatibility for in-situ and air-sensitive battery measurements.
Glove Box Compatible
Full N₂/Ar atmosphere operation for lithium metal, sulfide electrolytes, and other air-sensitive electrode materials.
EC-AFM Cell
Three-electrode electrochemical cell for in-situ ResiScope and KPFM during charge/discharge cycling.
Temperature Stage
–40°C to 450°C for thermal stability testing, low-temperature performance evaluation, and thermal runaway studies.
Soft ResiScope™
Friction-free electrical mapping for polymer binders, separator membranes, and other mechanically delicate battery components.
Request a Measurement Demo
Talk to our application specialists about KPFM and ResiScope™
measurement protocols for your specific sample and research question.
Summary
Conclusion
A polymer battery electrode combines microampere-level active particles with a picoampere-level binder, a current span that saturates the fixed gain of a standard C-AFM amplifier. ResiScope™ III adjusts its gain in real time and maps the whole range in one pass, without saturation or surface charging, and Soft ResiScope™ with HD-KFM™ III on the same area identifies particles that are both electronically disconnected and electrochemically inactive. With glove-box operation, an EC-AFM cell and a temperature stage, the Nano-Observer II brings these measurements from electrode design to degradation analysis.
In this application note
AFM scans and modes in this note
- AFM scan of polymer battery electrode — ResiScope™ III, 60 × 60 µm: conductive active particles (µA) and insulating binder (pA) resolved in one pass.
- AFM scan of polymer battery electrode — Soft ResiScope™ + HD-KFM™ III, 50 × 50 µm: resistance domains correlated with surface potential on the same area.
- AFM scan of battery electrode — ResiScope™ vs conductive AFM (C-AFM), 80 µm: saturation at 10 nA, capacitive effect and surface charging in C-AFM; cross-section current profile.
AFM modes used
FAQ
Frequently Asked Questions
Why use AFM for battery electrode characterization?
Battery electrode performance is determined by nanoscale heterogeneity that bulk measurements cannot resolve: local conductivity variations across active material particles, conductive additive distribution, SEI layer resistance, and ionic transport pathways all occur at length scales of 10 nm to 10 µm. AFM-based electrical techniques — particularly ResiScope™ — map resistance and current at each pixel simultaneously with topography, directly correlating morphology with local electrochemical activity. This enables targeted improvements in electrode formulation, conductive additive optimization, and degradation analysis that are impossible with area-averaged electrochemical methods.
What is the problem with standard conductive AFM (C-AFM) for battery materials?
Standard C-AFM fails on battery electrode materials due to three fundamental limitations: (1) Current saturation — highly conductive domains saturate the C-AFM amplifier at its maximum (typically 10 nA), producing measured values approximately 100× lower than actual conductivity; (2) Capacitive interference — capacitive effects prevent accurate measurement of small insulating domains adjacent to highly conductive regions; (3) Surface charging — the absence of protective resistance options causes observable surface charging artifacts along the scan direction, manifesting as baseline tilt in cross-sectional profiles. These artifacts make C-AFM unreliable for battery electrode analysis where conductivity spans 6–10 orders of magnitude within a single scan area.
How does ResiScope solve the dynamic range problem in battery AFM?
ResiScope™ uses a real-time DSP-driven AutoGain system with multiple linear gain stages (no logarithmic amplifiers), covering 10 decades of current from fA to μA and 10² to 10¹² ohms in resistance — all in a single scan pass. When the tip encounters a highly conductive domain (µA currents), the gain switches instantaneously. When it crosses into an insulating boundary (pA currents), the gain adjusts again — all without saturation, user intervention, or scan interruption. This is what makes it possible to faithfully map the bimodal conductivity distribution typical in polymer battery electrodes, where active material domains (µA) coexist with insulating binder/additive phases (pA) within a 60–80 µm scan area.
What does ResiScope reveal in polymer battery electrode materials?
ResiScope™ imaging of polymer battery electrodes reveals well-defined phase separation between high-conductivity domains (active material, typically in the µA current range) and insulating or low-conductivity domains (binder, PVDF, inactive regions, typically 1–70 pA). A 60×60 µm ResiScope scan can simultaneously resolve both conductivity regimes without saturation — enabling quantification of active material connectivity, identification of conductive additive clusters, detection of locally isolated particles, and mapping of high-resistance regions that limit rate capability and cycle life.
Can AFM measure both surface potential and conductivity on battery electrodes simultaneously?
Yes. The Nano-Observer II with HD-KFM III and Soft ResiScope can acquire surface potential (work function) and resistance/current maps on the same sample area in sequential passes. HD-KFM III surface potential maps reveal local electrochemical potential variations, SEI non-uniformity, and charge state heterogeneity across the electrode. Soft ResiScope provides the corresponding conductivity map. Correlating both datasets on the same 50×50 µm area directly links morphological, electrical, and electrochemical information — providing a complete nanoscale picture of electrode function.
What AFM modes are recommended for solid-state battery characterization?
For solid-state battery research, the recommended AFM suite on the Nano-Observer II includes: ResiScope III for ionic and electronic resistance mapping of solid electrolyte layers and electrode/electrolyte interfaces; Soft ResiScope for fragile ceramic or polymer electrolyte membranes where contact-mode AFM would cause damage; HD-KFM III for local work function and surface potential mapping correlated with Li-ion distribution; PFM (Piezoresponse Force Microscopy) for ferroelectric and piezoelectric ceramic electrolytes; and electrochemical AFM (EC-AFM) with a three-electrode cell for in-situ measurements during cycling.
Can battery electrodes be measured in a glove box or during cycling?
Yes. The Nano-Observer II battery configuration operates in a glove box under N₂ or Ar for air-sensitive materials, and a three-electrode electrochemical cell allows in-situ ResiScope and KPFM measurements during charge and discharge cycling.
How can polymer binders and separators be measured without damage?
With Soft ResiScope, which maps resistance in intermittent contact (Soft Interaction Control) instead of dragging the tip, so polymer binders, separator membranes and other delicate battery components are not damaged.