
Key takeaways
- Resonant-mode phase imaging separates the components of copolymers, blends and filled polymers — even when the topography is flat (copolymer at low force) or the domains are only 50 nm wide (carbon fillers).
- Force modulation maps relative stiffness on robust samples such as PS-PMMA blends.
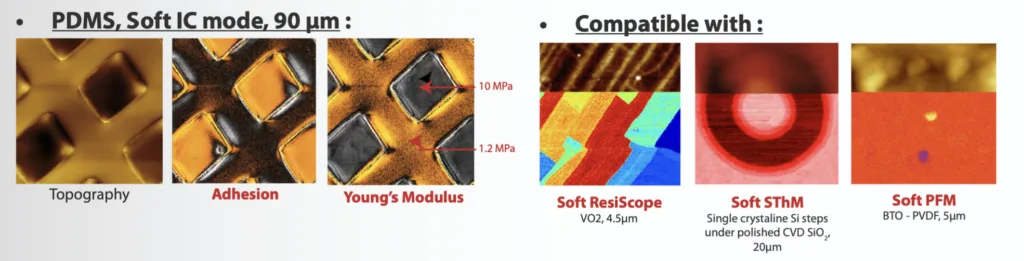
- Soft MEKA maps adhesion and Young’s modulus quantitatively, with no shear: 1.2–10 MPa across a PDMS sample.
- With temperature control, crystallization of PCL is followed in situ; Soft ResiScope and HD-KFM add electrical maps on the same polymers.
Introduction
Mechanics at the scale of the morphology
The properties of polymer blends, copolymers and composites come from their morphology — domains, lamellae, interphases and fillers tens of nanometres wide. AFM maps this morphology and the mechanical response of each component. Three AFM approaches give increasing levels of information: phase contrast, force modulation and quantitative nanomechanical mapping with Soft MEKA.
Level 1
Phase imaging in resonant mode
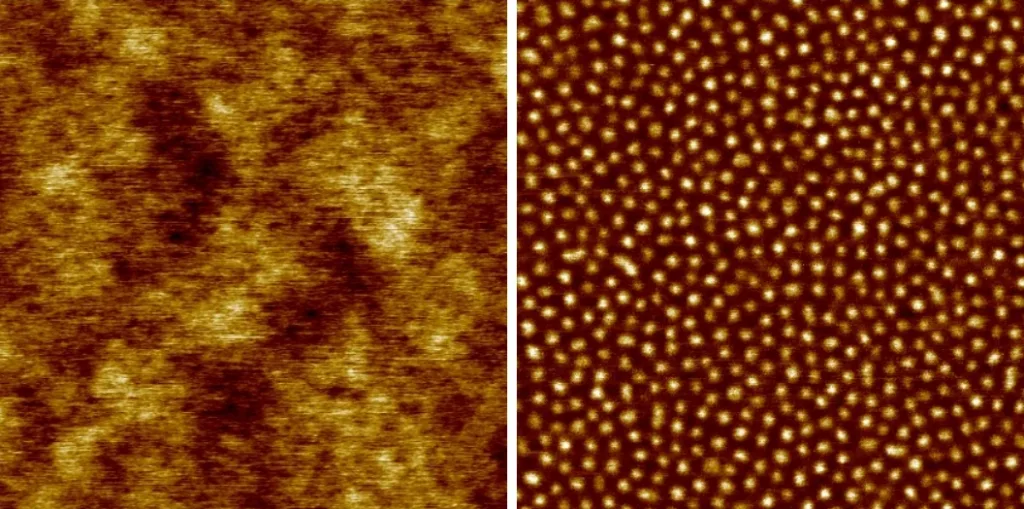
In resonant (tapping) mode, the phase of the cantilever oscillation changes with the tip–sample interaction. On a copolymer imaged at low force, the topography is flat but the phase separates the polymers (Figure 1). On a polymer composite with carbon fillers, the phase image distinguishes 50 nm-wide carbon domains (bright) from the polymer matrix (Figure 2).
Level 2
Force modulation
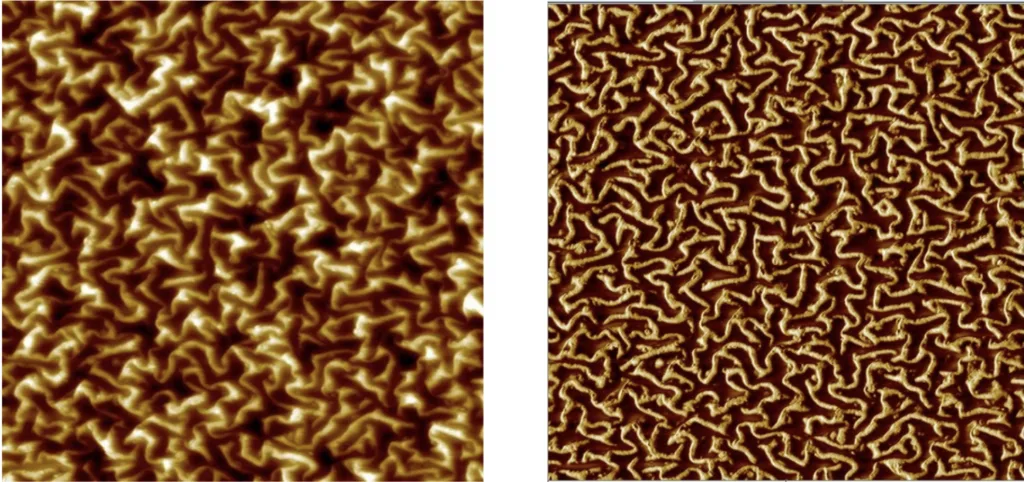
In force modulation the tip stays in contact and a small oscillation is applied; the amplitude and phase of the response follow local stiffness and viscoelasticity (Figure 4). It is fast and well suited to robust samples; on fragile or sticky surfaces the contact oscillation can mix topography into the signal and damage the material.
Level 3
Quantitative maps with Soft MEKA
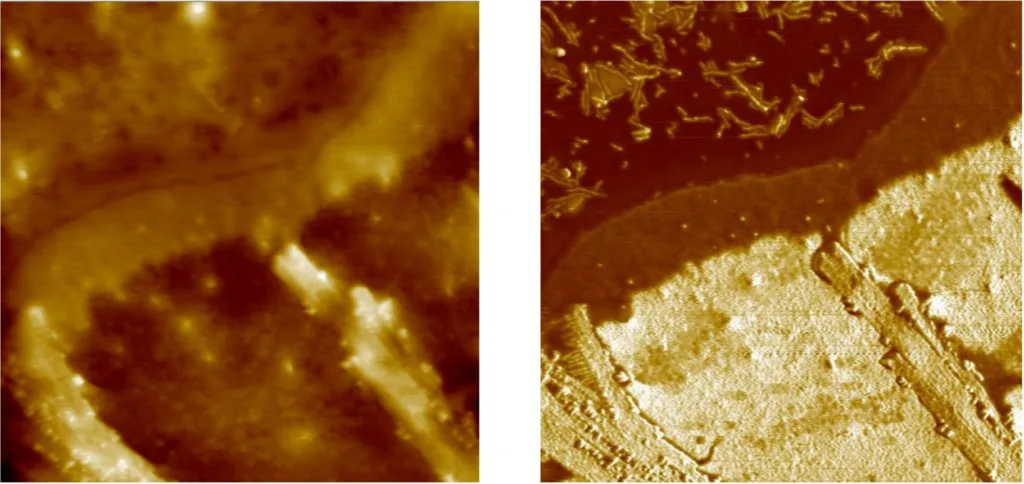
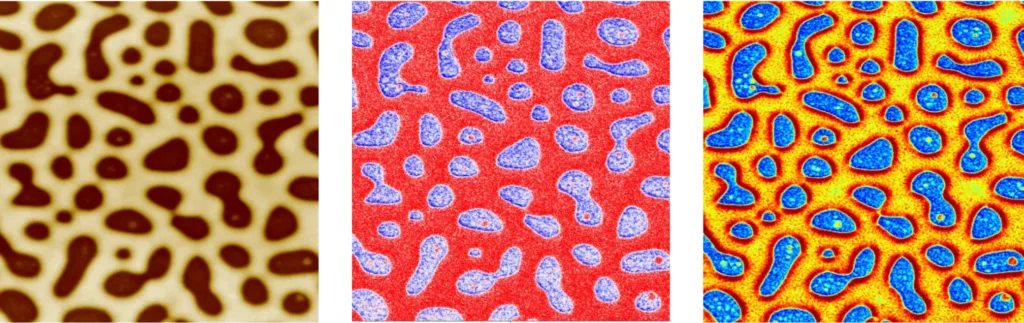
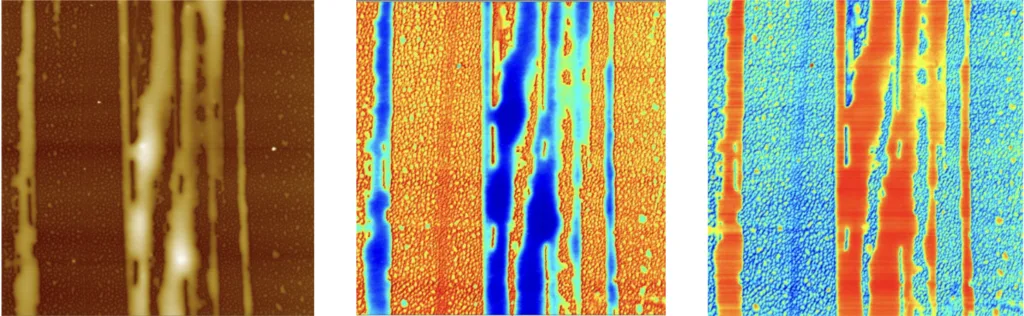
Soft MEKA runs on Soft Interaction Control: at every pixel the tip approaches, touches the surface with a set force and retracts fully before moving on — no lateral force, no shear. Each force curve gives the contact stiffness, converted to Young’s modulus, and the pull-off (adhesion) force. On PDMS (Figure 5), modulus from 1.2 to 10 MPa and adhesion are mapped together with the topography; on PDES on silicon (Figure 6), topography, adhesion and stiffness are recorded in one pass. Every point keeps its force curve, so maps can be re-analysed afterwards.
Comparison
Which mechanical mode for which polymer question
| Mode | Output | Best for |
|---|---|---|
| Phase imaging (resonant mode) | Qualitative contrast between components | Morphology of blends, copolymers, composites; soft samples at low force |
| Force modulation | Relative stiffness and viscoelastic contrast | Fast mapping of robust samples |
| Soft MEKA | Young’s modulus and adhesion maps, force curve at every point | Polymers, gels, adhesives, coatings, loose particles — quantitative, no shear |
| Nano-indentation / force spectroscopy | Single-point force–distance curves | Deep indentation and full force–distance studies at chosen points |
Beyond mechanics
Temperature and electrical properties
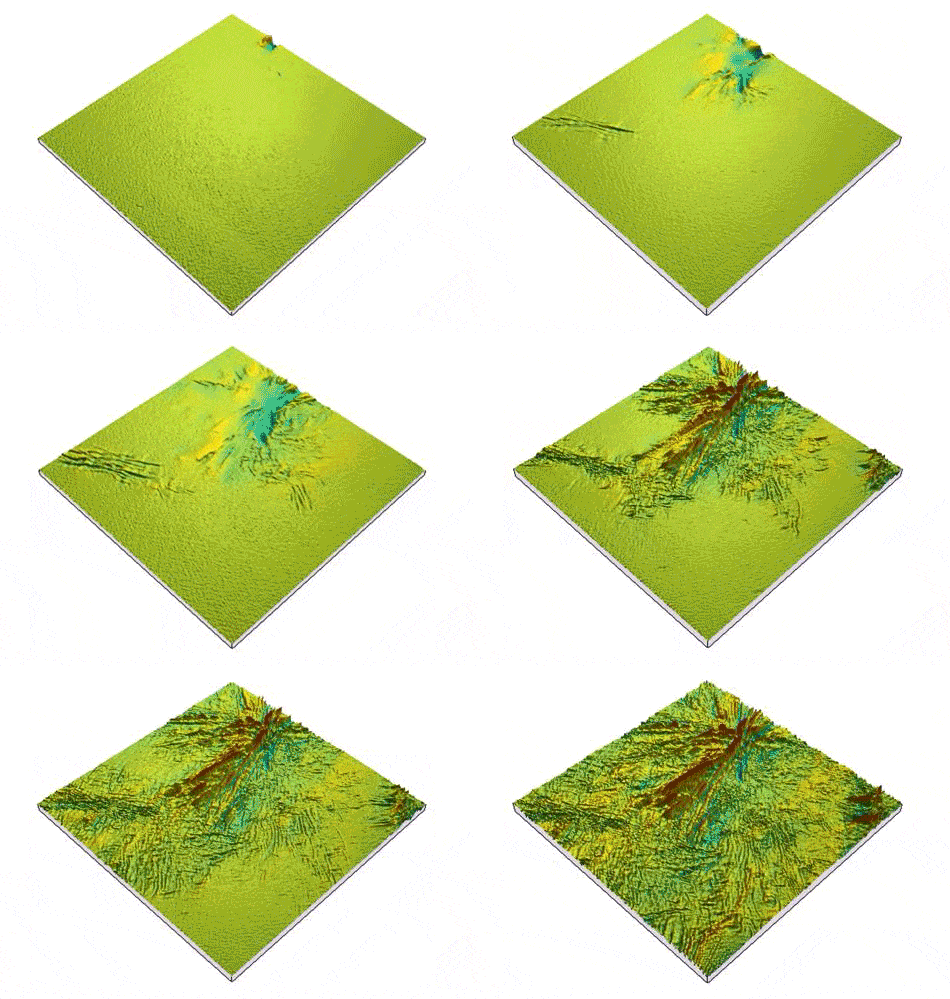
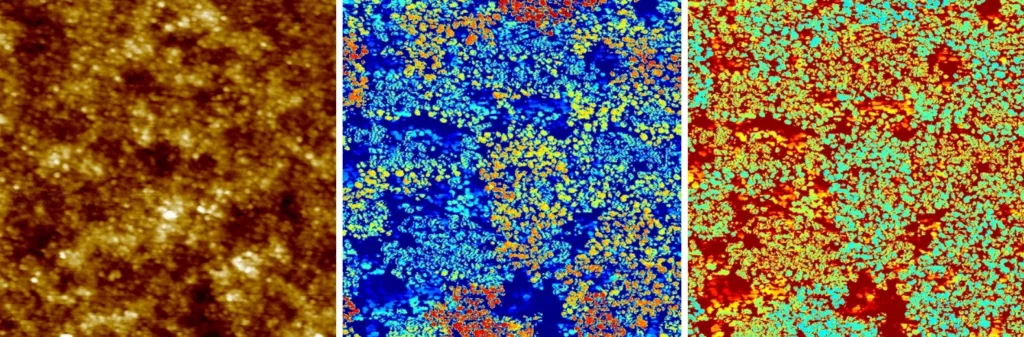
With temperature control, polymer transitions are followed in situ: PCL heated to 60 °C shows a smooth surface, and as the temperature decreases, micron-size round crystals grow (Figure 7). The same polymers can be mapped electrically: Soft ResiScope measures current and resistance of a polymer with metallic particles without friction (Figure 8), and HD-KFM maps the surface potential of a semiconducting polymer.
Summary
Conclusion
Phase imaging reveals polymer morphology, force modulation adds relative stiffness on robust samples, and Soft MEKA turns it into quantitative modulus and adhesion maps without shear. On the Nano-Observer II these measurements share one platform with temperature control and with friction-free electrical modes, so morphology, mechanics and conduction can be compared on the same polymer.
In this note
AFM modes used
FAQ
Frequently Asked Questions
How does AFM measure the mechanical properties of polymers?
At three levels: phase imaging in resonant mode gives qualitative contrast between components; force modulation gives fast relative stiffness contrast in contact; Soft MEKA records a force curve at every point and maps adhesion, stiffness and Young’s modulus quantitatively.
What does the AFM phase image show on a polymer blend?
Differences in how the tip interacts with each component — stiffness, adhesion, dissipation. On a copolymer at low force, the topography is flat but the phase image shows the different polymers.
How is Young’s modulus measured by AFM on soft polymers?
With Soft MEKA: at every point the tip touches the surface with a set force and retracts; the contact stiffness from each force curve is converted into Young’s modulus. On PDMS, values from 1.2 to 10 MPa were mapped in one scan together with adhesion.
Force modulation or Soft MEKA for polymers?
Force modulation gives fast relative contrast on robust samples, but the tip stays in contact and is oscillated, which can mix topography into the mechanical signal and damage soft or weakly attached material. Soft MEKA gives quantitative values with no shear.
Can AFM follow polymer crystallization?
Yes. With temperature control, resonant-mode imaging follows PCL as it is heated to 60 °C and then crystallizes on cooling, with micron-size spherulites growing in the topography.
Can electrical properties of polymers be measured too?
Yes. Soft ResiScope maps current and resistance on polymers with metallic particles without friction, and HD-KFM maps the surface potential of semiconducting polymers.
Characterize your polymer samples
Ask the application scientists behind our AFMs and modes — about your samples, probes, set-up or which mode fits your measurement. We answer every message personally.