
AFM for semiconductor characterization
Dopant profiles, junctions and devices at the nanoscale
CSInstruments, a French manufacturer of atomic force microscopes, builds the Nano-Observer II for electrical characterization of semiconductors. The scans below were recorded with three of its modes:
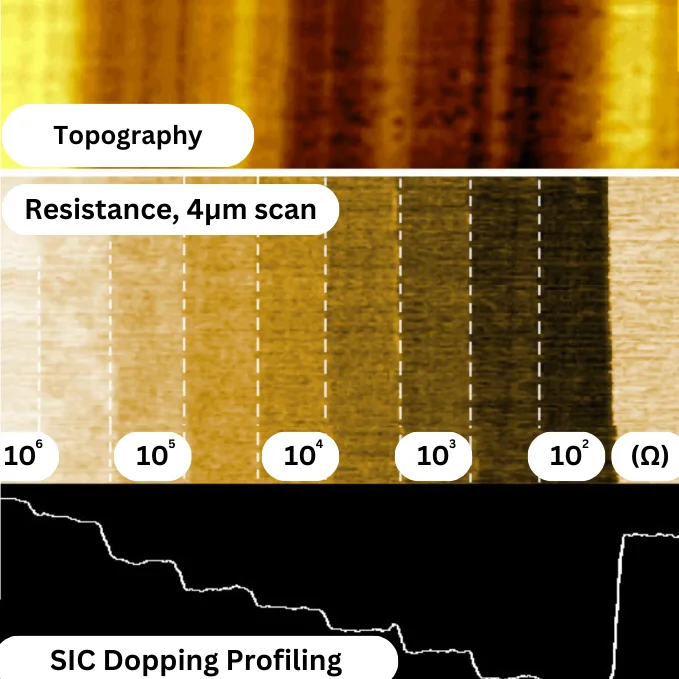
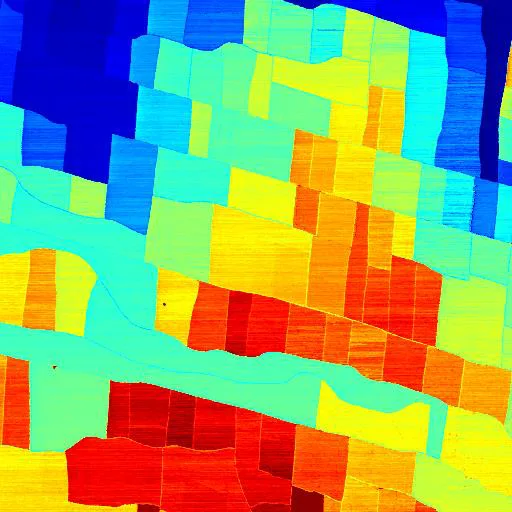
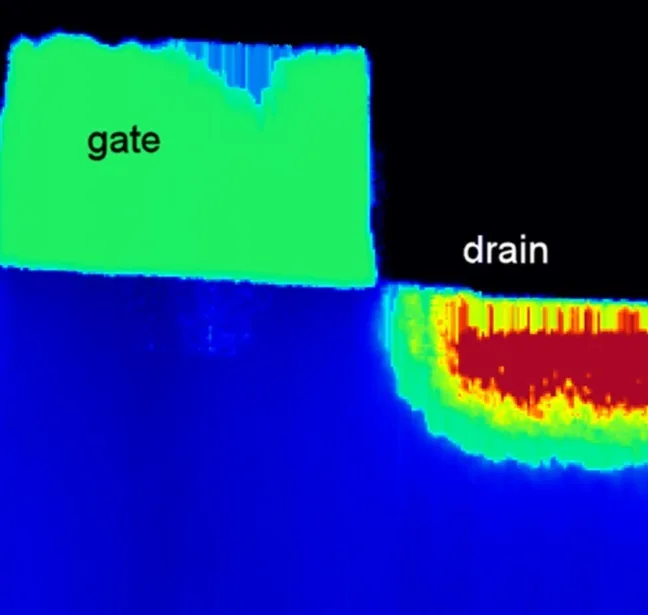
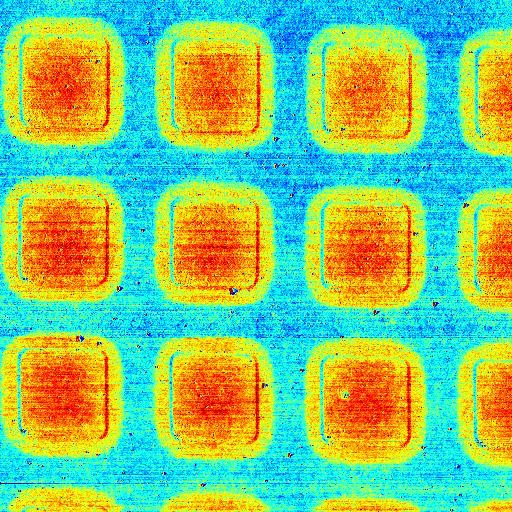
- Dopant profiling — ResiScope™ resistance on a silicon cross-section with regions of increasing carrier concentration, on doped dots and on a cleaved transistor (drain and gate).
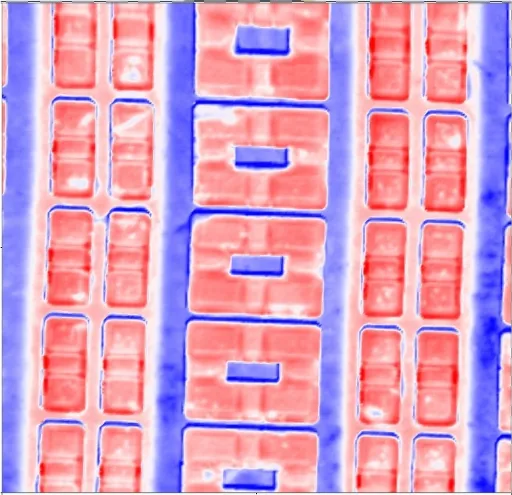
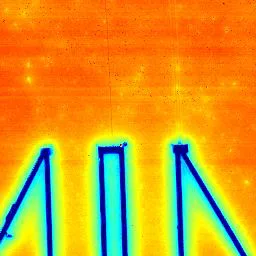
- p, n and n+ regions — HD-KFM™ surface potential of an SRAM memory device, implanted n-doped structures, biased electrodes and trenches.
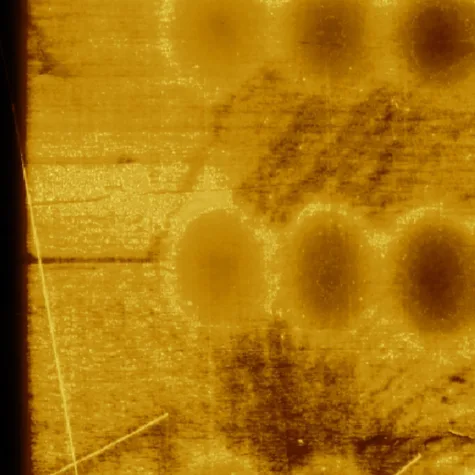
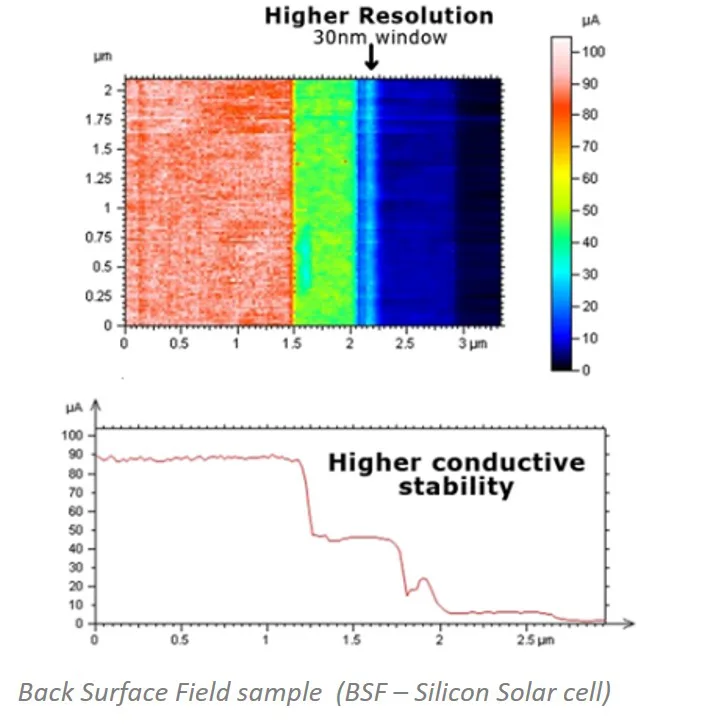
- Phase transitions and solar cells — metal–insulator domains in VO₂ films and the multilayer structure of a silicon solar cell, in current and resistance.
- Dielectric and microwave contrast — dC/dZ imaging with HD-KFM™ III and scanning microwave impedance microscopy (sMIM).
- Existing AFMs — the same modes can be added to Bruker, Agilent and Keysight AFMs with the Galaxy Dual Controller.
Images
Videos
FAQ
Frequently Asked Questions
What AFM techniques are used for semiconductor characterization?
The two primary AFM techniques for semiconductor electrical characterization are KPFM (Kelvin Probe Force Microscopy) for surface potential and work function mapping, and conductive AFM / ResiScope™ for resistance and current mapping. On the CSInstruments Nano-Observer II, HD-KFM III provides single-pass surface potential mapping with sub-10 nm resolution — enabling dopant profiling, p-n junction visualization, and in-operando device characterization. ResiScope™ III covers 10 decades of resistance (10² to 10¹² ohms) in a single scan, resolving both highly conductive and highly resistive regions without saturation — critical for multi-layer semiconductor cross-sections.
Can AFM map dopant concentration in semiconductors?
Yes. Both HD-KFM III and ResiScope™ can map dopant concentration variations in semiconductor materials. HD-KFM III measures surface potential differences between p, n, and n+ regions — as demonstrated in SRAM memory device and silicon doped structure images, where distinct potential levels correlate with doping type and concentration. ResiScope™ measures resistance directly, where higher doping concentration produces lower resistance — as seen in SiC staircase doping profiles (100 ohm to 1 Mohm across a 500 nm cross-section) and doped dot arrays with increasing carrier concentration.
How does AFM characterize transistors and SRAM devices?
Transistor and SRAM characterization by AFM is performed on polished cross-sections of the device. ResiScope™ resistance mapping on transistor cross-sections (1.5 µm scan) resolves drain, gate, and p/n/n+ regions with sub-100 nm resolution. HD-KFM III surface potential mapping of SRAM devices (50 µm scan) provides a full map of doped region distribution without saturation at any boundary — a key limitation of standard lift-mode KPFM that HD-KFM III overcomes through single-pass bimodal excitation.
What is the Back Surface Field (BSF) in solar cells and how does AFM detect it?
The Back Surface Field (BSF) is a heavily doped thin layer at the rear of a silicon solar cell that creates a potential barrier preventing minority carrier recombination at the back contact, thereby increasing cell efficiency. The BSF is typically 30–100 nm thick — detectable only by high-resolution techniques. ResiScope™ on the Nano-Observer II has demonstrated direct BSF detection in silicon solar cell cross-sections: its fast DSP-driven gain response resolves the BSF as a distinct high-current layer within the blue (low-conductivity) region, simultaneously demonstrating a dynamic range of 150 pA to 90 µA and integrated protective current limiting.
What is the VO2 metal-insulator transition and how is it characterized by AFM?
Vanadium dioxide (VO2) undergoes a metal-insulator transition (MIT) near 68°C, switching from an insulating monoclinic phase to a conductive rutile phase. This transition is highly sensitive to film thickness, strain, and local composition. ResiScope™ AFM imaging of VO2 thin films maps the spatial distribution of conductive and insulating domains in real time — resolving blocks of metallic VO2 separated by insulating VO2 walls at 10 µm scale. The real-time AutoGain of ResiScope™ ensures both resistance regimes are accurately captured in the same image without switching measurement ranges.
Which AFM modes are used for semiconductor characterization?
Resistance or current mapping (ResiScope, conductive AFM) for dopant profiling and device cross-sections, Kelvin probe force microscopy (HD-KFM) for surface potential of p, n and n+ regions, dC/dZ and scanning microwave impedance (sMIM) for dielectric contrast.
Can AFM measure dopant concentration in silicon?
Yes. ResiScope resistance on a silicon cross-section separates regions of increasing carrier concentration, and HD-KFM surface potential distinguishes p, n and n+ regions, for example in an SRAM memory device.
Which company makes AFMs for semiconductor dopant profiling?
CSInstruments, a French AFM manufacturer, makes the Nano-Observer II with ResiScope III and HD-KFM III, and adds the same modes to existing Bruker, Agilent and Keysight AFMs with the Galaxy Dual Controller.