
Application fields
Key Features
Force Spectroscopy
- Quantitative Force Measurements: Accurately determine adhesion, stiffness, and molecular interaction forces.
- Wide Force Range: From picoNewtons to microNewtons, accommodating diverse applications.
- High Sensitivity: Detect subtle changes in tip-sample interactions with picoNewton precision.
- Versatility: Applicable in ambient, liquid, and controlled environments.
- Real-Time Analysis: Obtain immediate feedback on force-distance relationships.
Applications of Force Spectroscopy
Adhesion Studies
- Quantify surface adhesion forces in polymers, coatings, and thin films.
- Evaluate anti-adhesive and lubricating properties.
Elasticity Measurements
- Characterize material stiffness in polymers, composites, and biological samples.
- Study viscoelastic properties and mechanical behavior.
Molecular Interactions
- Investigate receptor-ligand binding forces in biomolecular research.
- Analyze protein unfolding and DNA stretching mechanics.
How does Force Spectroscopy work?
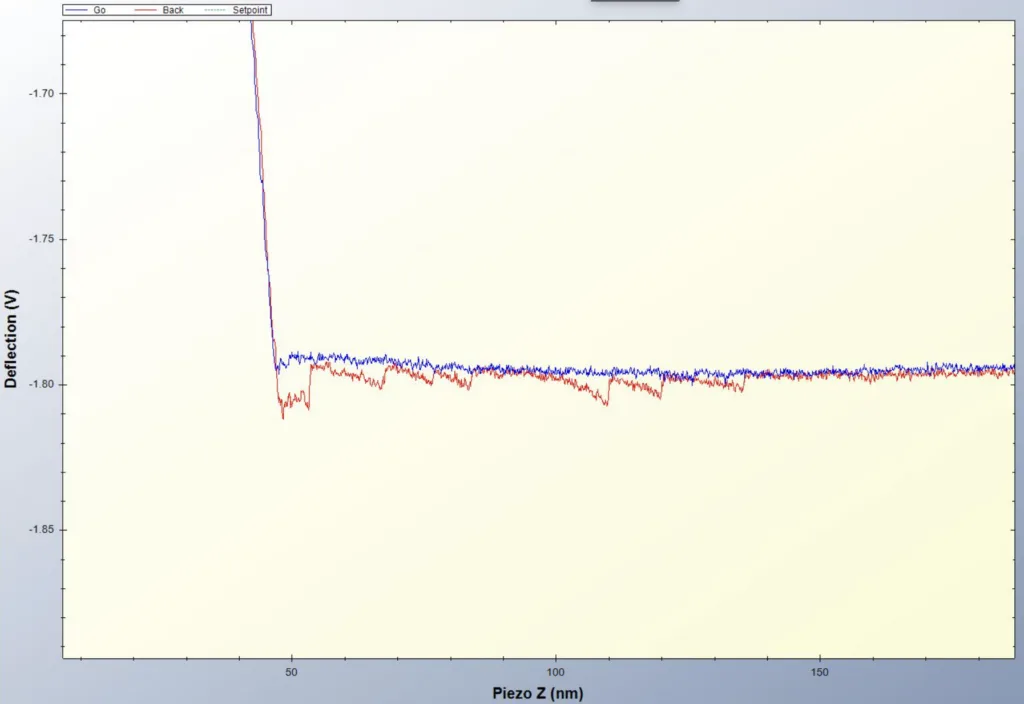
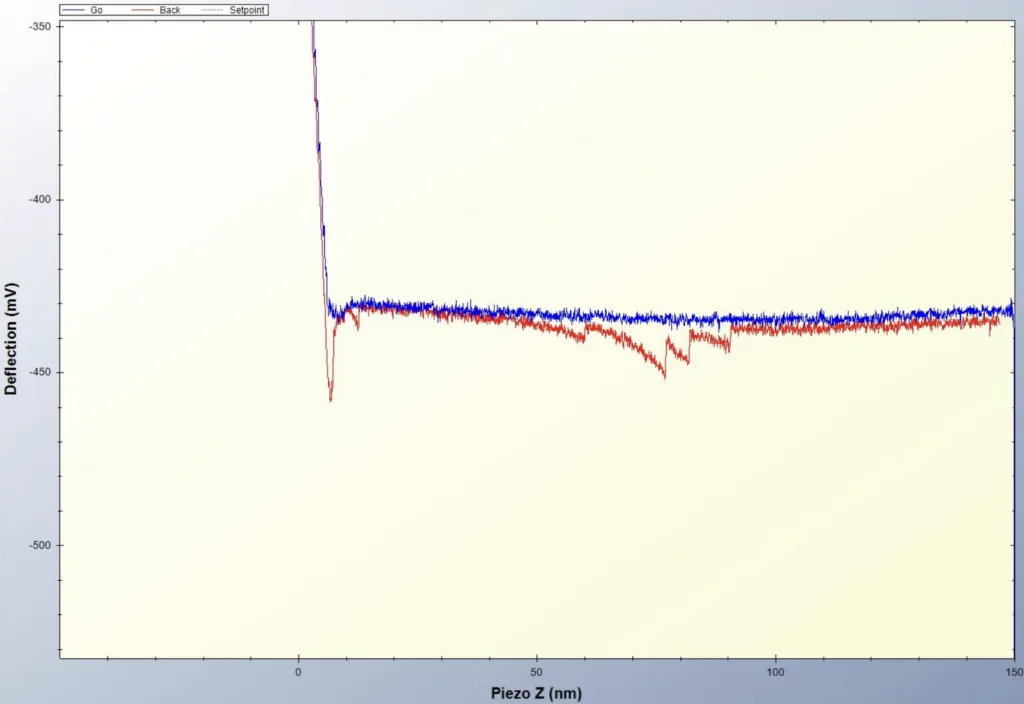
Force Spectroscopy involves measuring the deflection of an AFM probe as it approaches and retracts from a sample surface. The resulting force-distance curves reveal key mechanical and molecular properties, such as adhesion forces, Young’s modulus, and energy dissipation.
Specifications
- Force Sensitivity: PicoNewton-level resolution.
- Displacement Control: Sub-nanometer precision.
- Operating Environments: Air, liquid, and controlled atmospheres.
- Sample Types: Soft and hard materials, biological specimens, and thin films.
How to read it
The AFM force–distance curve, step by step
- Approach and contact — the piezo moves the probe towards the surface; once in contact, the cantilever deflection rises with the displacement. The slope gives the contact stiffness, from which mechanical properties are calculated.
- Hold — the tip can be held at a constant deflection (force) for a short time; electrical measurements made here are taken at a known, constant force.
- Retract and pull-off — on retraction the deflection decreases until the adhesion can no longer hold the tip: the jump-off gives the adhesion (pull-off) force.
- Analysis — stiffness is converted into Young’s modulus; adhesion is read in force units; repeated at many points, the curves become maps (see Soft MEKA).
Force and deflection are related by Hooke’s law, F = k·d, with k the spring constant of the cantilever — which is why the probe is chosen to match the stiffness of the sample (probe guide).
FAQ
Frequently Asked Questions
What is an AFM force–distance curve?
The record of the cantilever deflection (force) while the probe approaches the surface, touches it and retracts. The approach slope gives the contact stiffness and Young’s modulus; the retraction gives the adhesion (pull-off) force.
How is adhesion measured from a force curve?
On retraction, the tip stays attached to the surface until the cantilever force exceeds the adhesion; the force at which it jumps off is the pull-off or adhesion force.
What is the difference between force spectroscopy and Soft MEKA?
Force spectroscopy records force curves at chosen points for detailed study; Soft MEKA records one force curve per pixel during imaging and turns them into stiffness, adhesion and Young’s modulus maps.
Questions about Force Spectroscopy?
Ask the application scientists behind our AFMs and modes — about your samples, probes, set-up or which mode fits your measurement. We answer every message personally.